Measure and Compare
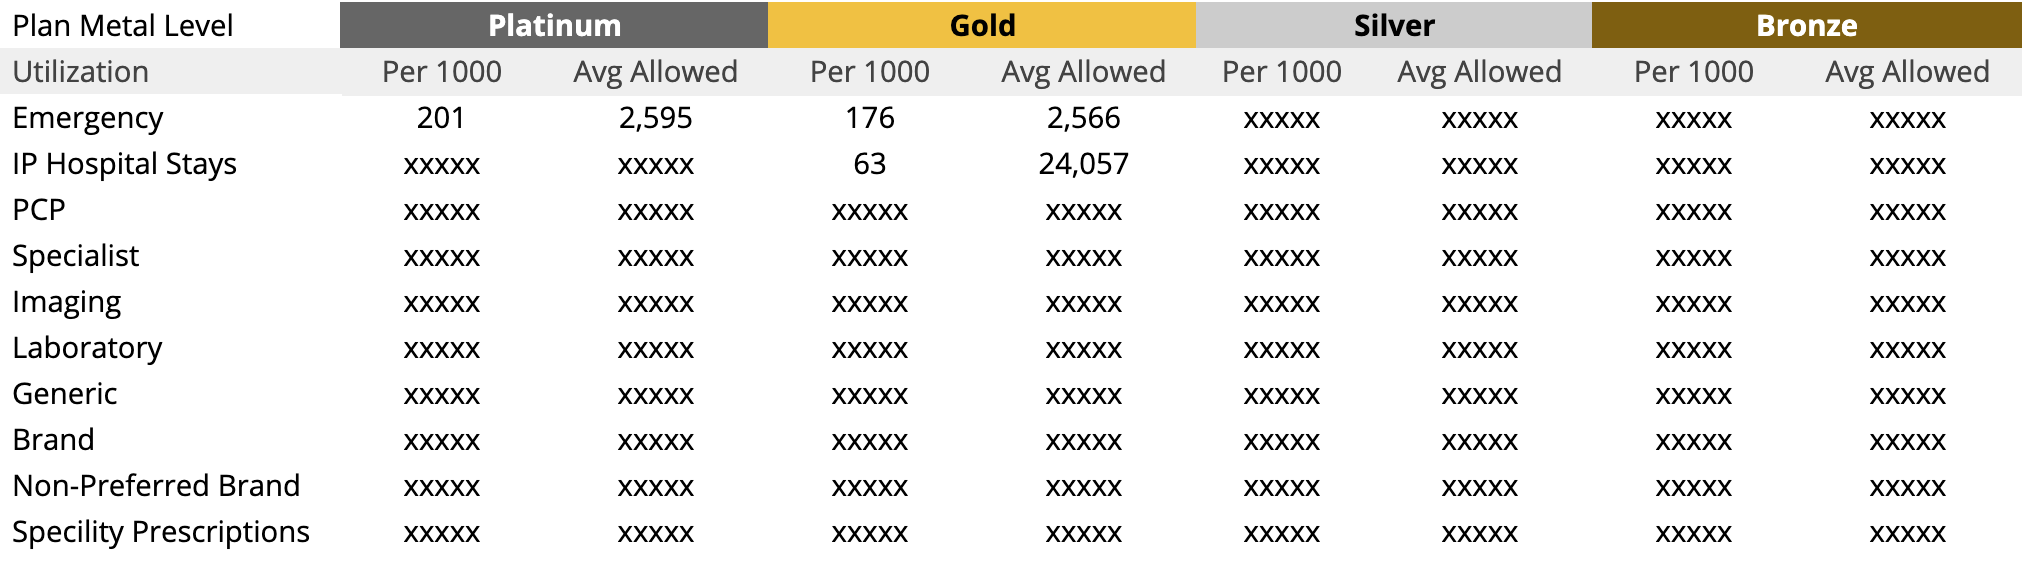
Measure. Benchmark. Use for high cost claimant analyses, claims ranges by percentiles, and more. Units of care per 1,000; average allowed cost per unti.

Four Tables & Summary
Metal levels approximate actuarial values, or, on average, the percentage of in-network claims paid by insurance.

Data
US commercially-insured data from 2017 trended to 2021 for medical and prescription utilization across over 8M lives and four plan metal levels

Delivery
Automatically delivered via excel download.