


The Kaiser Family Foundation (KFF) Employer Benefits survey underlying data, trended from 2020 and 2021 data + proprietary employer data.
The version and most recent effective date are always listed below the percentile gauges.
Once per year for KFF data; employer data is loaded periodically. Latest version is effective July 2022.
Updates as of 2021 are summarized here
Plan value approximates actuarial value, or, on average, the percentage of in-network claims paid by insurance. Values range between 60% to over 90% and are often referred to by metal levels. Bronze is 60%, Silver 70%, Gold 80%, and Platinum 90% +/- 2%. Healthier people will have lower claims and pay a greater percentage, while those with higher claims will pay a lower percentage of the value.
A multiple regression model run using over 100 distinct plan designs and the output actuarial value from the CMS actuarial value calculator–it was found that ~85% of the actuarial value of a plan is determined by 3 factors: deductible, coinsurance, and out-of-pocket maximum. Actual results are within 1-2% for most plan structures and modeling maxes out at ~95% actuarial (plan) value, equal to the 99th percentile for comparison purposes; this can be thought of as a modeling asymptote.
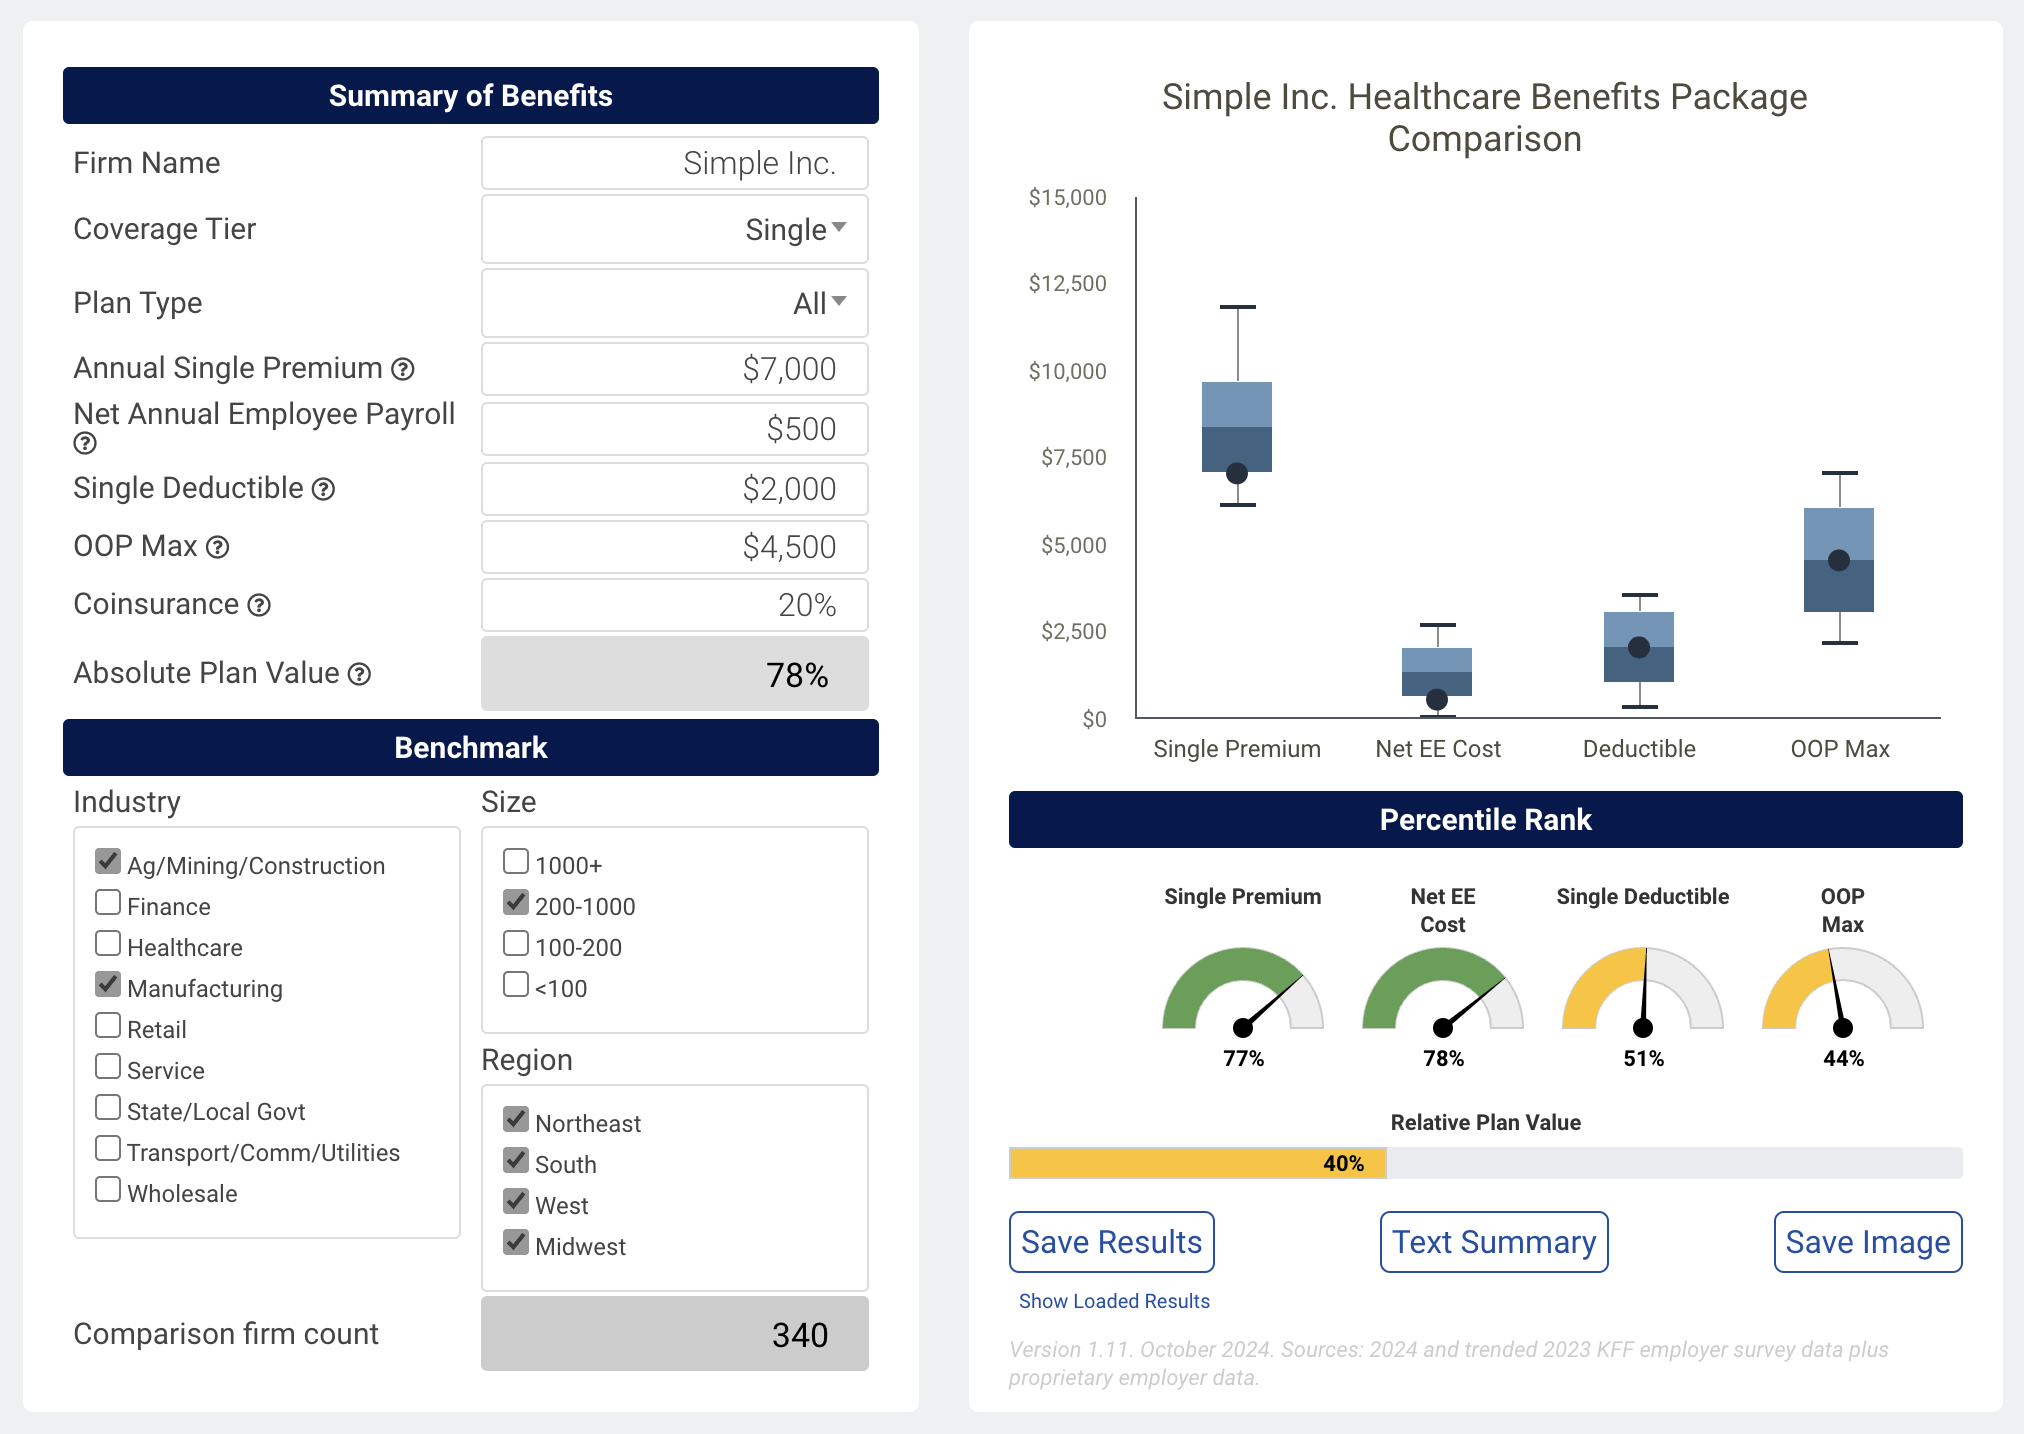
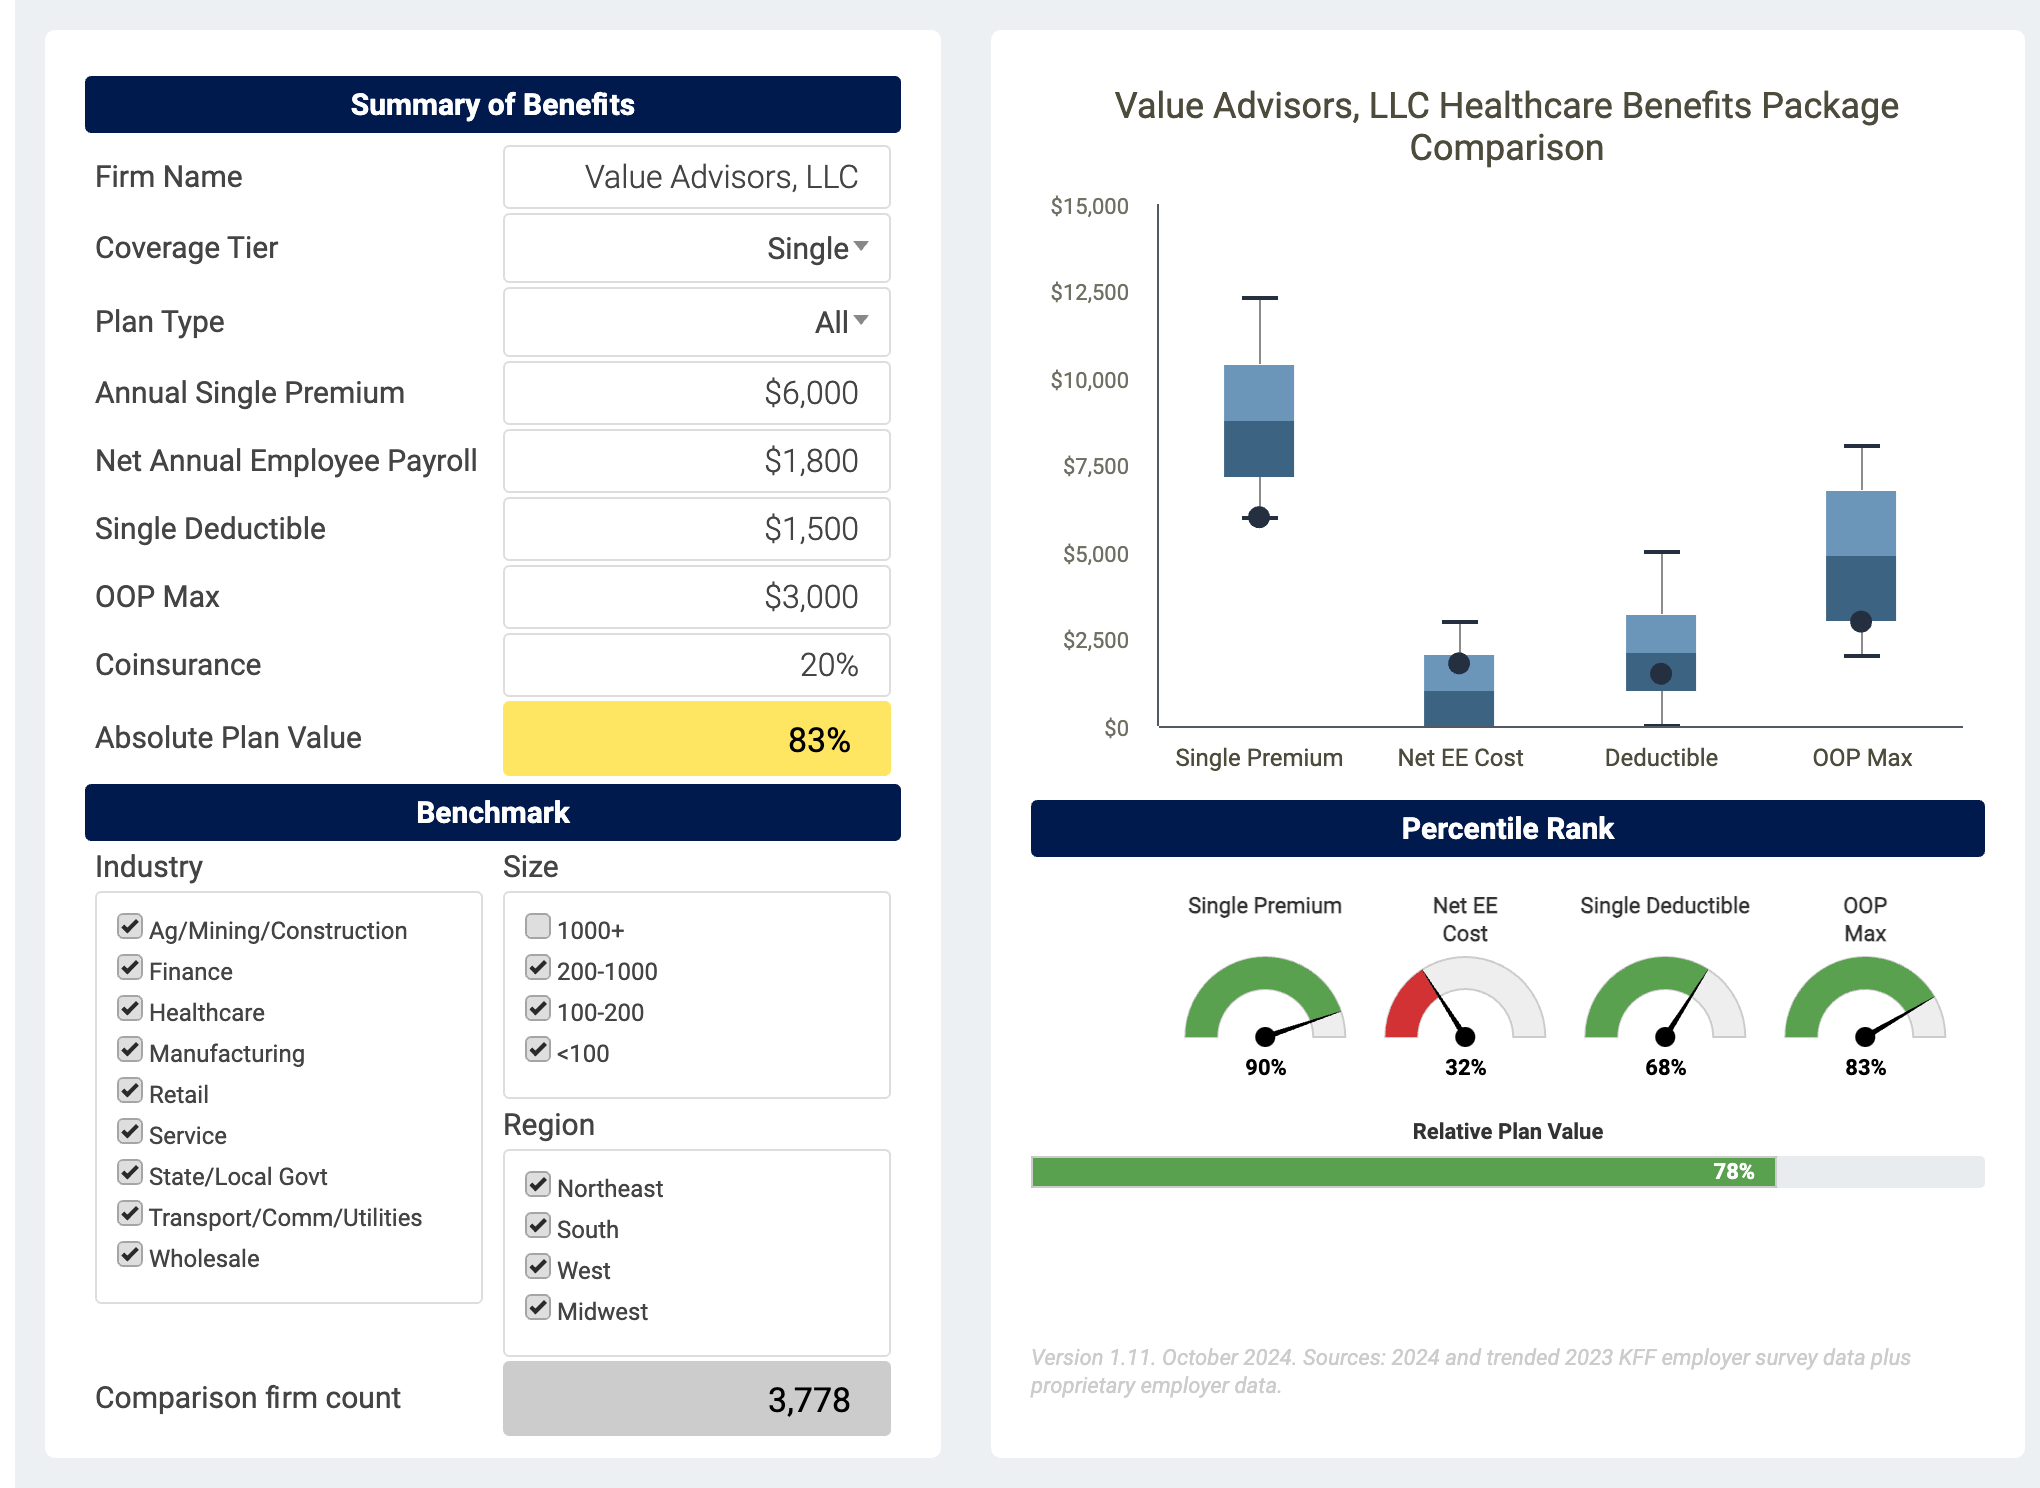
Plan value, actuarial value, or metal value, under the “summary of benefits” area is an absolute number, and an estimate of what percentage of claims the plan pays on average. 90% is a Platinum level benefit; Gold 80%, Silver 70%, and Bronze 60%, +/- two to three %.
The plan value gauge below the chart on the right is a value relative to the cohort selected, the percentile ranking. For example, 58% in percentile ranking means the firm or group in question has a more generous plan design than 58% of comparison firms.
An atypical plan design like $0 deductible and $7,000 out-of-pocket max may have a skewed plan value number. If you use outlier values like $15,000 deductibles you will not get an error. Results should end up being between 60-90% for virtually all comparable plans.
The ranges in the charts are the dollar values that reflect the middle 50% (the interquartile range, or the 25th to 75th percentiles) as well as the top and bottom 10%. If you hover you’ll over each chart you’ll see dollars and percentiles as well as the comparison firm in question.
The color-coded gauges reflect the percentile ranking of the modeled firm relative to the cohort selected. Green means the top third most attractive (most competitive) or 67th to 100th percentiles; yellow is the middle third or 34th to 66th percentile; and red means the one-third least competitive or 0 to 33rd percentile.
The data for individual firms reflect the average numbers if there are multiple plans–so if half the employees are enrolled in a $1,000 deductible plan and half are in a $3,000 deductible plan, the number represented for comparison purposes in the charts is $2,000. Firms typically offer 1-3 plans to their employees. Future versions of the tool may have a breakdown by plan types and/or metal levels.
The plan types across the 4,000+ firms in the data are 49% PPO, 29% HDHP, 12% HMO, 10% POS/Other based on covered lives. Smaller firms will have a greater share of HDHPs.
Yes, it reflects an aggregate deductible, which is the case for 90% of plans.
Any firm contributions to HSAs or similar accounts, for modeling, should be netted out of what an employee pays via payroll “Net annual employee payroll.” For example, if an employee with single coverage pays $2,000 per year for health insurance coverage (or $83 per pay period), but is given $500 in HSA contributions from the firm, the net amount to input would be $1,500. Employee contributions to HSA accounts should not be used in the modeling exercise as no net dollars are impacted.
There is clustering around certain attributes, such as coinsurance. Many plans have 20% coinsurance.
Some healthcare plans have a mix of copays and coinsurance. A plan with a $25 office visit copay is approximately a 20% copay given typical charges. If there are scenarios where office visits are free and hospitalizations are 20%, you can use 20% as the coinsurance or 15-19%, since the bulk of actuarial value hinges on higher dollar categories
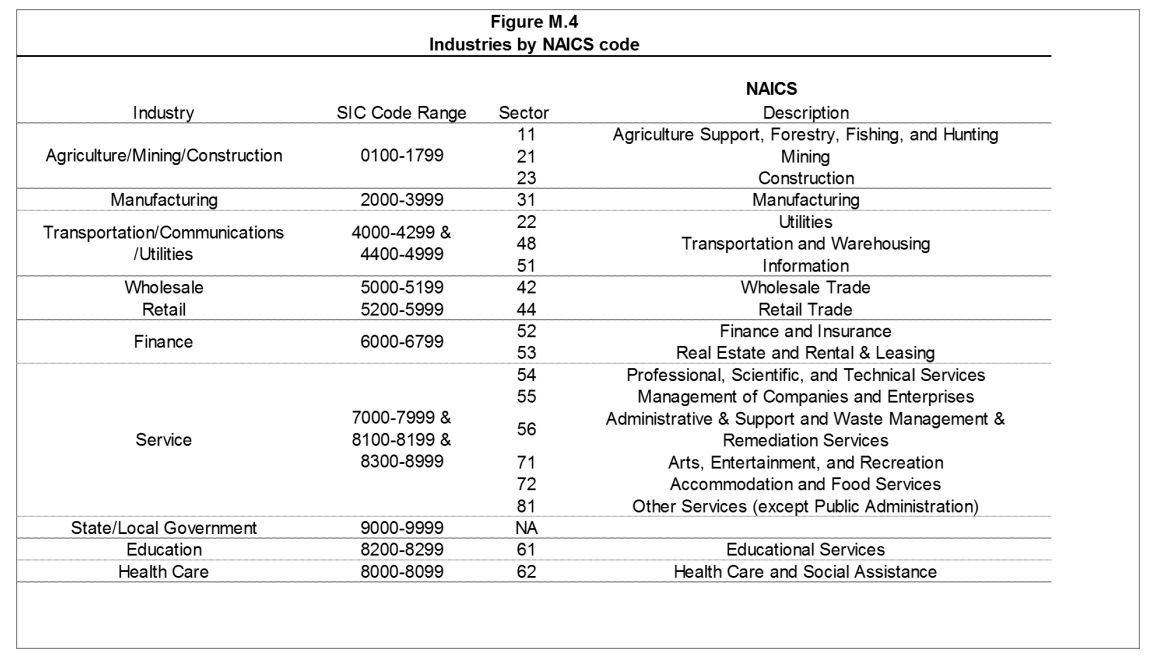
The four regions used in the tool are West, South, Midwest, and Northeast, and are based on the BLS classifications of regions.
No. While the tool will work in mobile, it is cleanest and easiest to use for desktop.
Payments are securely managed via Stripe. Our default method is credit or debit card but we are currently (March 2022) working on integrating with Plaid to do ACH as well. To make any changes, please contact us.
