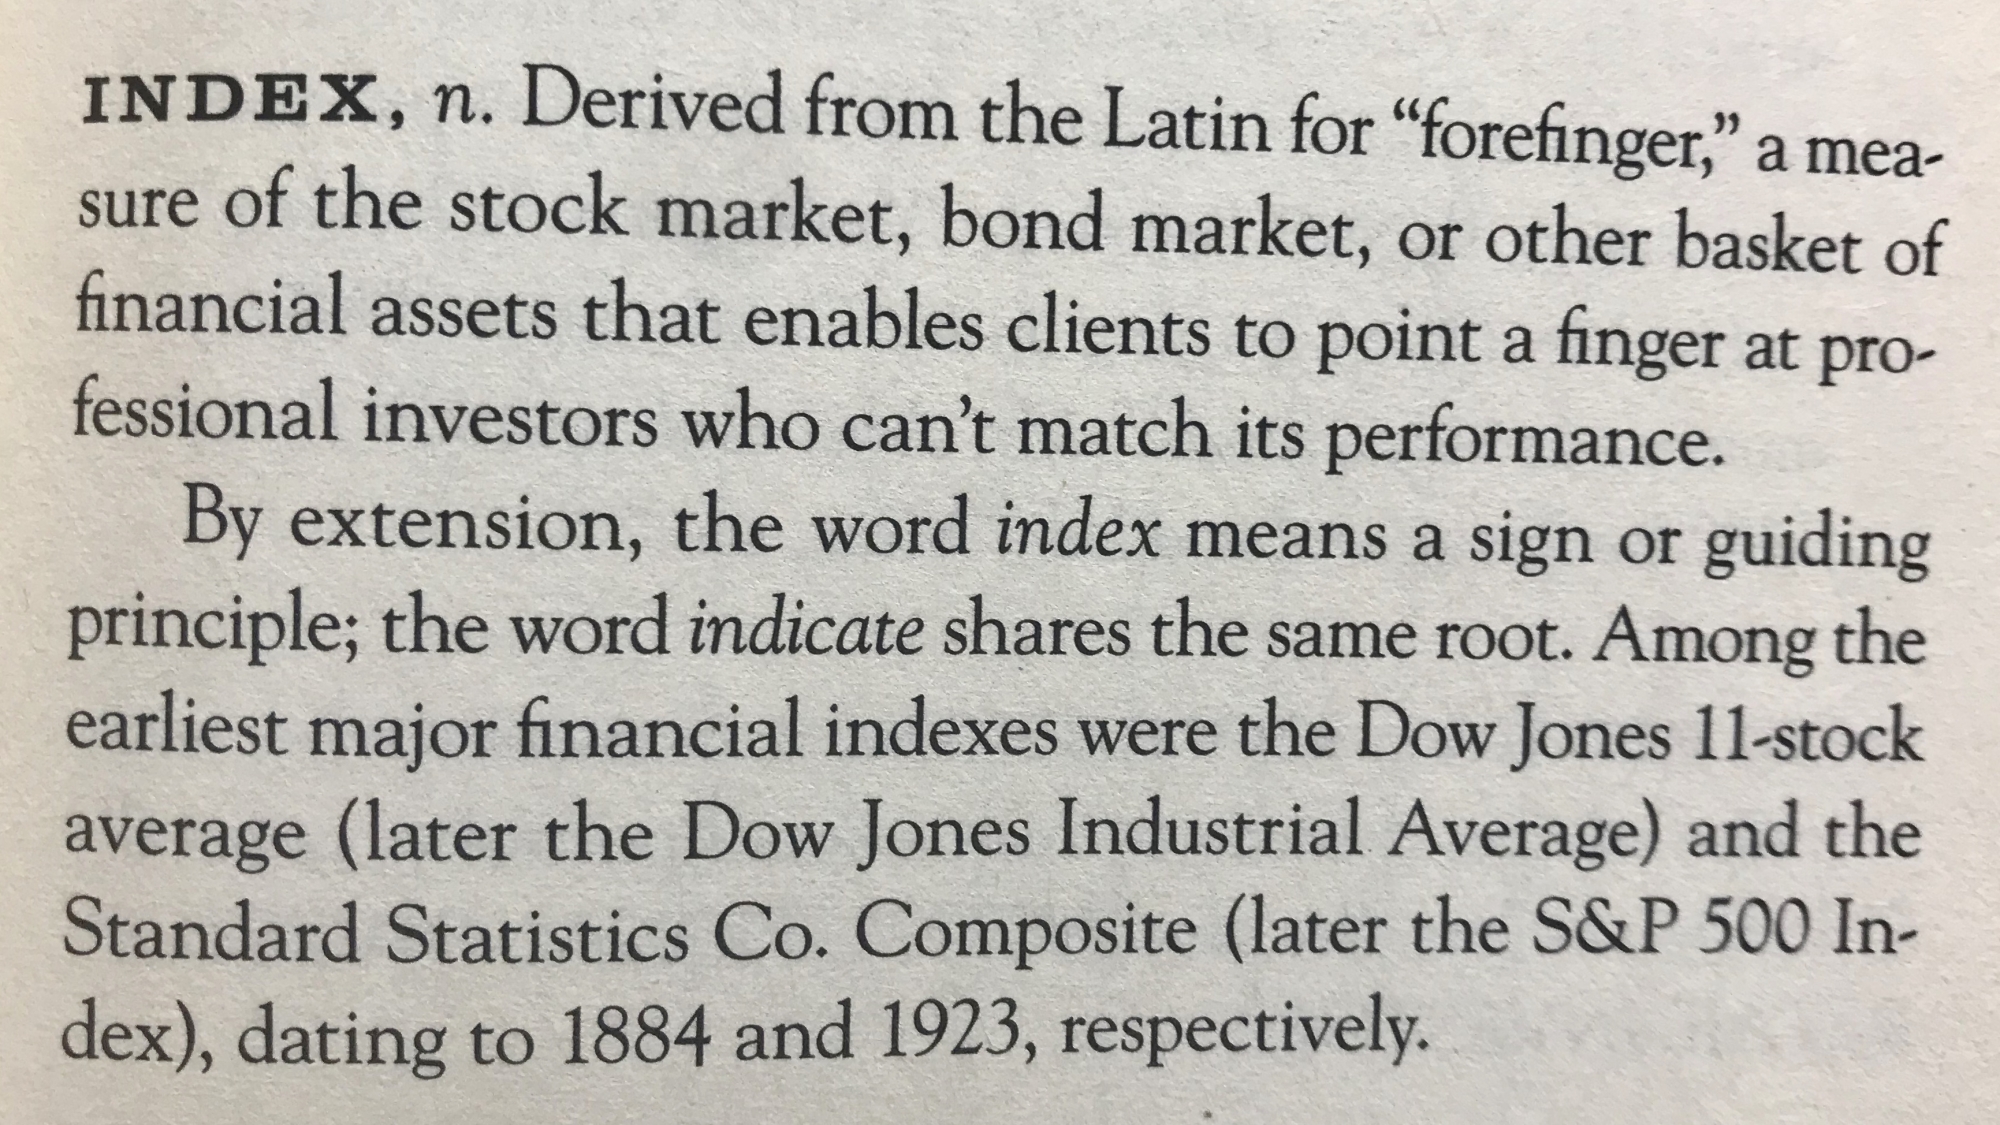
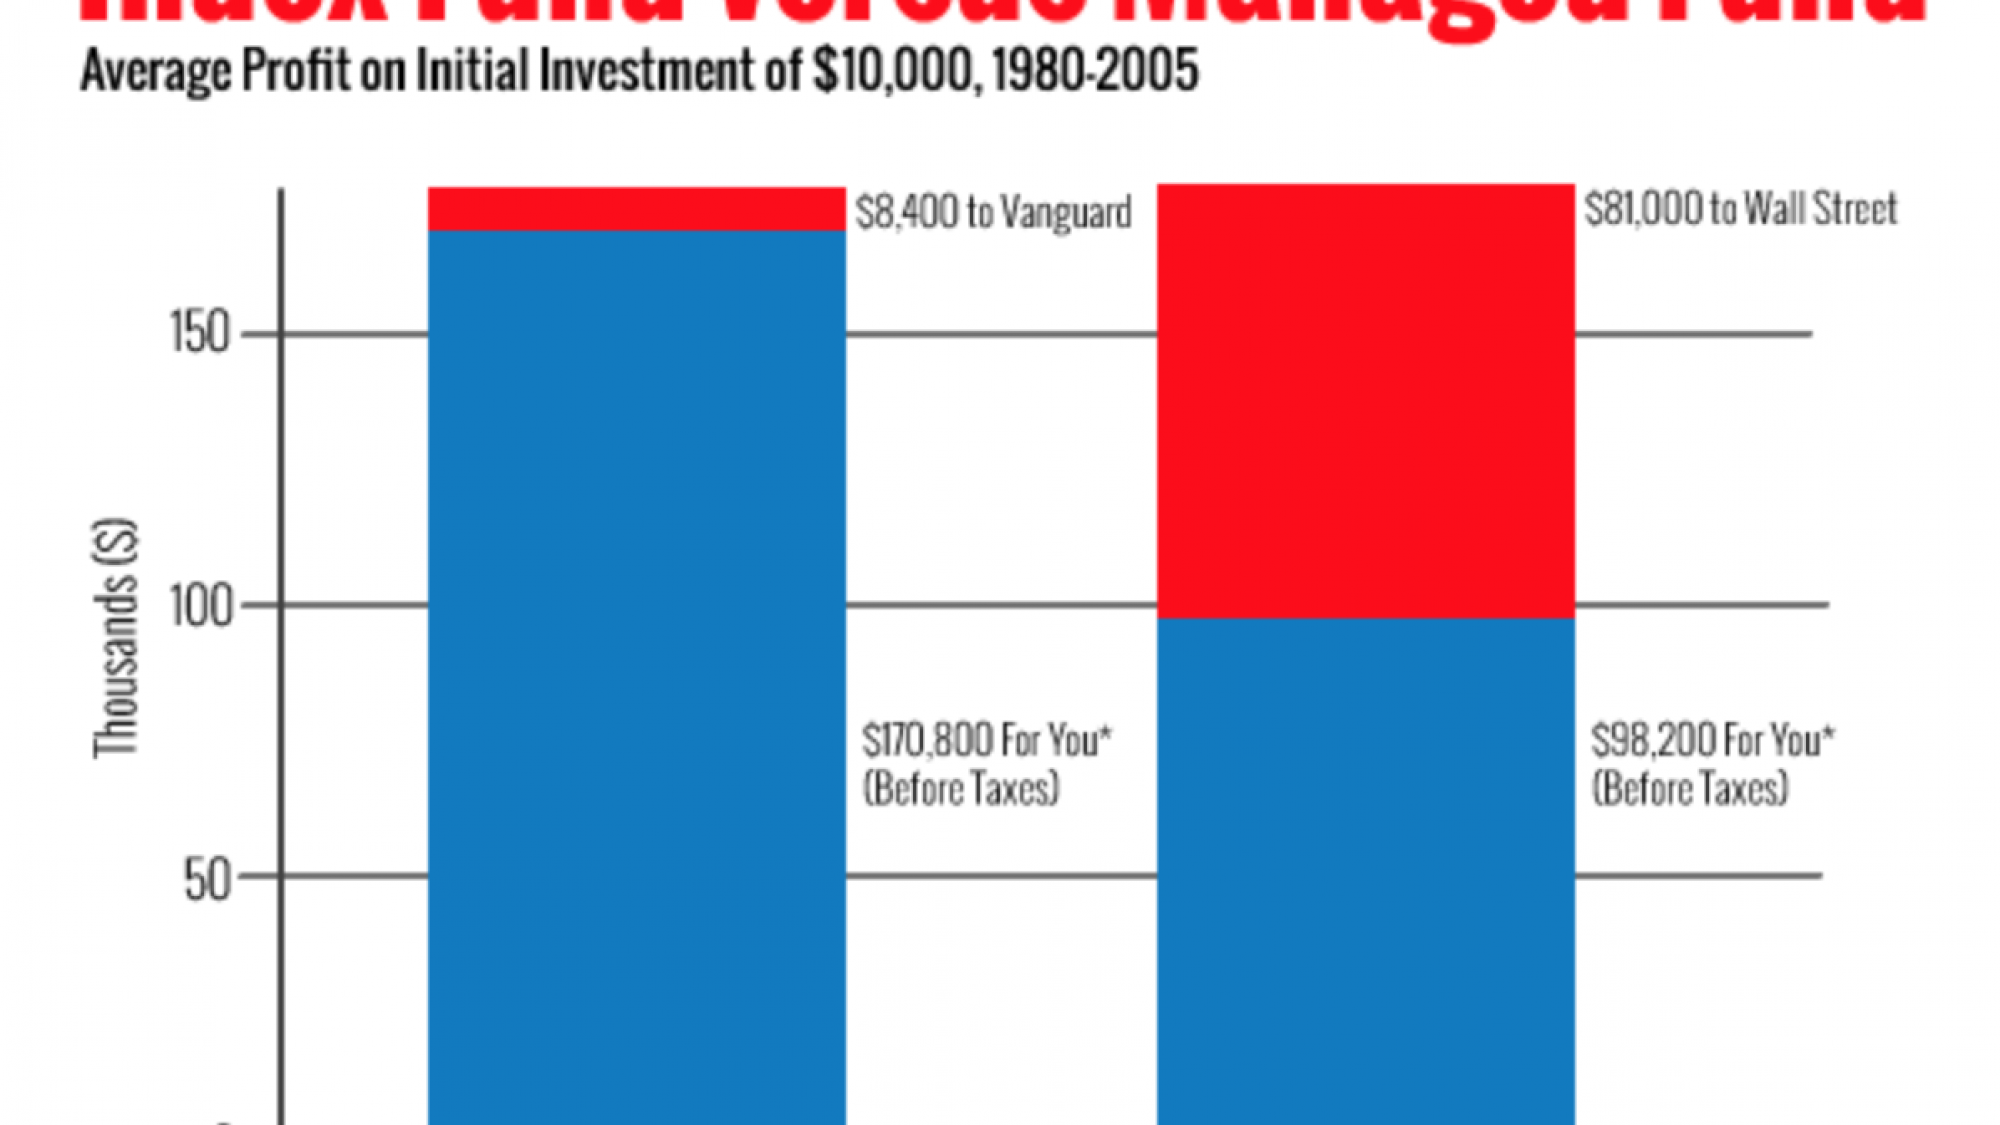
This month's index covers housing inflation in San Francisco, airline costs, tulip prices relative to wages, and a potpourri of numbers on healthcare. Housing units in San Francisco in 1980: 316,608 Housing units in 2014: 386,610 Relative growth per ye ...
April’s Index
While not as funny as the image above, this month's index brings cool, interesting, and thought-provoking stats related to healthcare and finance. Enjoy. Percentage of HealthyEquity's revenue derived from monthly services fees: 35%. In 2014: 50%. ...
March’s Index
As a tip of the hat to the beautiful Harper's Index, here is the March Index on cool, interesting, and thought-provoking stats related to healthcare and finance. Change in hospital discharges per 1,000 in the US since 1999: -10%. Hospital discharge ...
February’s Index
A monthly list of interesting facts and figures from the world of healthcare, finance, and public markets. 2/3: The estimated number of Medicare quality metrics deemed uncertain or invalid by a NEJM study. 25%: the percentage of healthcare costs at ...
January’s Healthcare Index
Inspired by the monthly Harper's Index, this is 2019's first index on healthcare and finance. The average ratio of Medicaid-to-Medicare payments spending across the US across all services: .72; In CA: .52. The factor by which commercial insurance p ...


