In many ways, I’m a below average driver. I only drive about 4,000 miles a year so I don’t get much practice. I use a blinker most of the time but I’m not always courteous. Sometimes I cut in at the last minute, which I recently read is actually good for traffic flows, even it if makes me reticent about checking my mirror for the gestures of other drivers. I do return the favor and let people in. I run red lights when the risks are low. However, I can parallel park, and I drive well in the snow. I’ve never caused an accident, but 10 years ago I was t-boned by a lab researcher coming off a graveyard shift. Average in this case is viewed as better than half the people, which is the median.
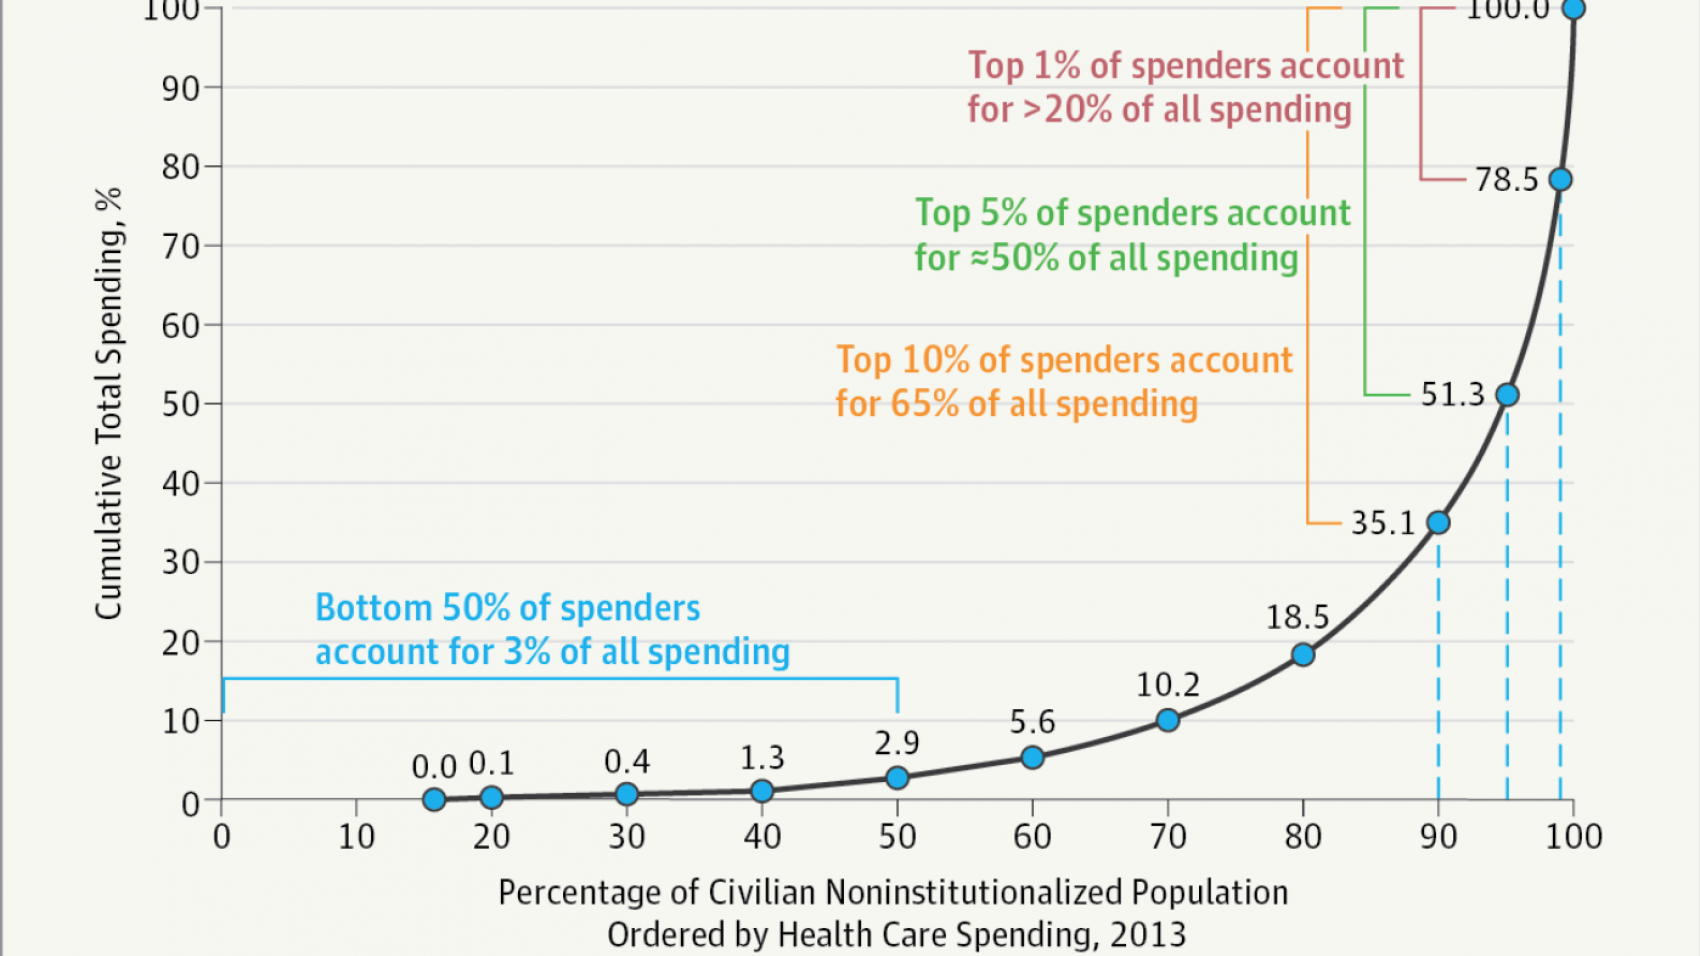
Last year I wrote about averages and medians and how we should use them with caution. In some areas, the choice of average (mean) and median is virtually interchangeable. Average ? median in height, shoe size, home square footage, driving skills, even total healthcare premiums across companies. But anything with “average” employee costs should not be used as interchangeable as a “typical” user. The reason, in healthcare spending, nearly 4 in 5 people are below average. Spend 20 seconds looking at the header image.
If “average” is the 80th percentile in healthcare claims in a given year, what would it be over time for any one person, and what are the implications for choosing a health plan and thinking about insurance as protection? I recently analyzed 3 years of medical claims for one 3,000 life employer and found that <4% of single employees were above average for three years in a row. It drops to <2% if you’re under 40. The reason? Few people under 65 get hospitalized–when they do, it’s usually for maternity care, an infection, or an accident. Hospitalizations have declined over the years and are at ~60 per 1,000 lives per year for those with employer-sponsored insurance. Something to consider when vendors talk about mining for sick people.
This skew is why economists talk so much about median wages or median household income. It’s to measure the middle of the pack. When reading healthcare research, you’ll find averages, uses of “typical”, but rarely median. When in doubt, look for both, and clarify what “typical” means.
Fidelity publishes a big study each year on healthcare costs in retirement. The estimated pot of money a couple needs in retirement for healthcare costs is now reported as $280,000. I emailed at least three times last year on this to get clarification. I sent another email today. Based on the numbers I ran, they’re assuming someone is “average” each year. If that’s the case, it overstates the needs for most. I guess it’s too hard for them to backtrack on; the distinction isn’t worth noting for some. Maybe it’s better for people to be overprepared (though I’d imagine this may work against some if the goal is perceived as simply too high).
Medical and prescription drug claims, peas in a pod, land ownership in Italy, taxes paid, problems caused by students in a class, and many more follow the 80/20 rule, a form of the power law. There is a health-wealth distribution kinship. 1% of patients account for 25%+ of total claims, right in line with taxes; approximately 1% of the population pays 25% of the taxes (2016 IRS tax year data). Many wish those numbers were different.

