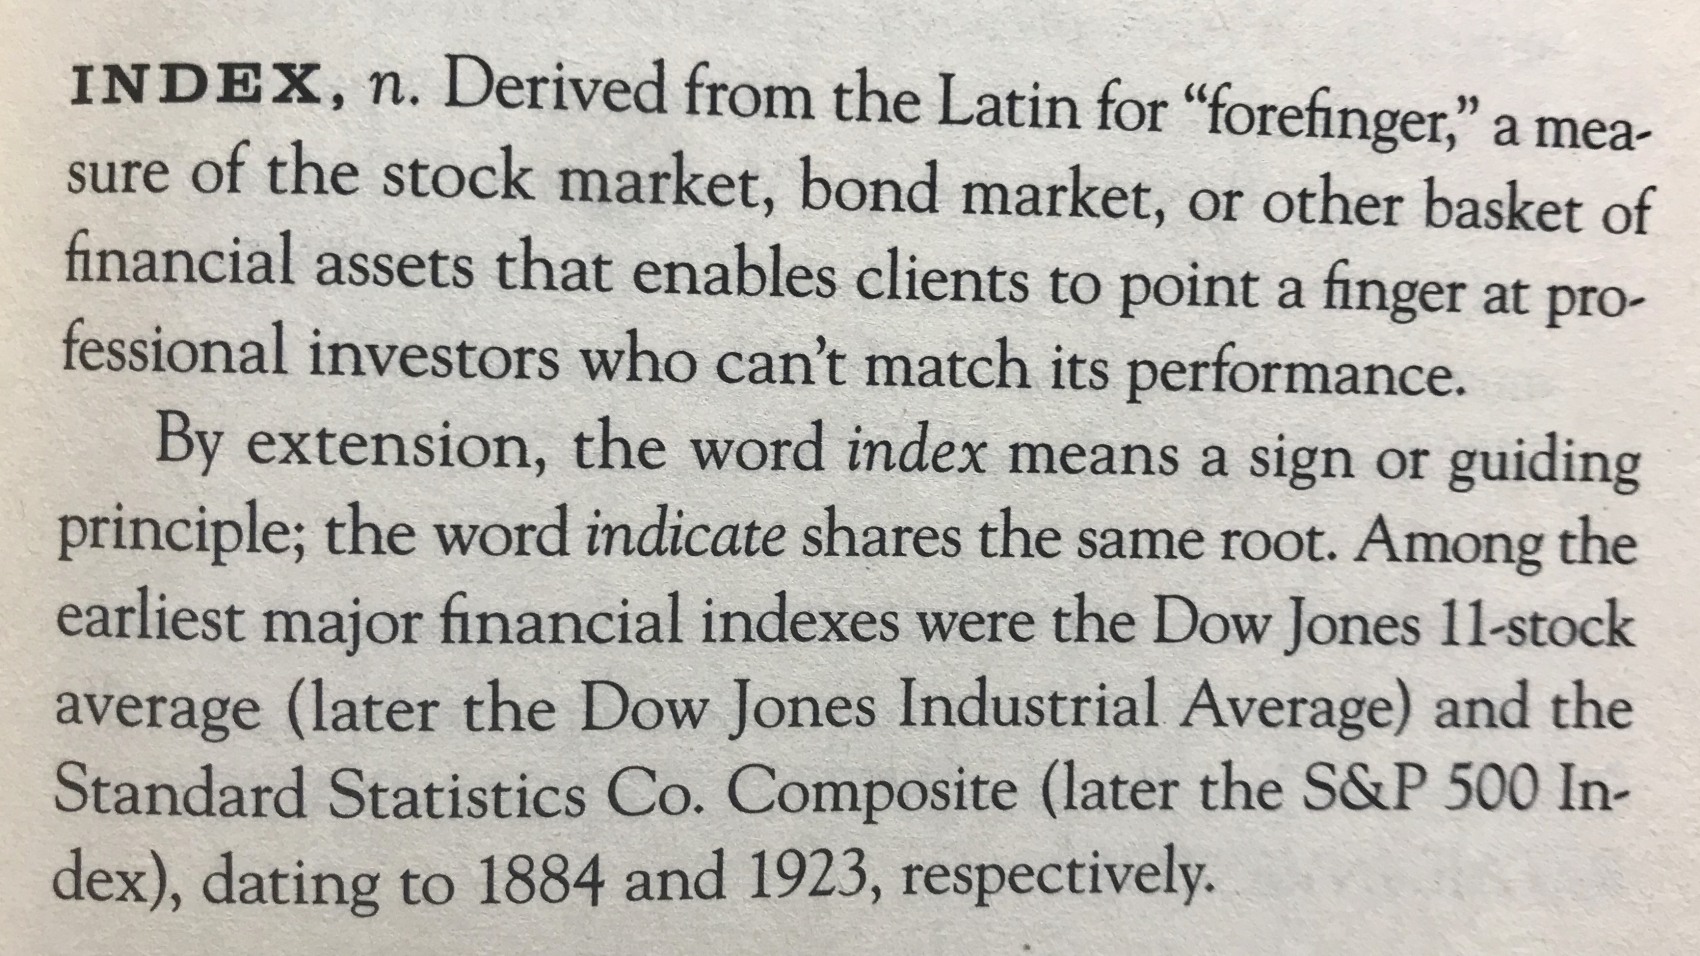
While not as funny as the image above, this month’s index brings cool, interesting, and thought-provoking stats related to healthcare and finance. Enjoy.
Percentage of HealthyEquity’s revenue derived from monthly services fees: 35%.
In 2014: 50%.
The dollar value of moving up one metal tier for a single employee with employer-provided coverage: $450-500 (Analysis of underlying data from the Kaiser Foundation 2018 Employer Survey).
Cost of an average emergency room visit in the United States for those under 65 with commercial insurance: $2,000 (CMS 2018 continuance tables).
The number of times Lyft’s shares traded hands on average on the opening day of its IPO: 2.3x (71.49M shares vs. 30.77M offering).
Mean first-day return of IPOs (1980-2017, market close vs. offer price): 17.8%.
Lyft’s return after first day’s close: 8.7%.
Long-term annualized IPO underperformance relative to the market: 2-3%.
Average cumulative performance relative to the S&P 500 of the last 150 US IPOs: -4%. Data here and compared to first day market close price. Approximately the last 12 months of IPOs.
Number of times “reimbursement” was mentioned in Walgreen’s 2019 2nd quarter earnings call: 33.
Times mentioned in the 2019 1st quarter call: 8.
Walgreen’s stock price change since its December 2018 high: -36.5%.
Number of acquisitions made by Arthur J. Gallagher (ticker: AJG) since 2002: 507.
Acquisitions in 2018: 48.
Average purchase price: $21.1M.
Goodwill and other intangible assets as a % total assets: 38%.
2018 EBITDAC (earnings before interest, taxes, depreciation, amortization, and estimated acquisition earn-out payables): $1.3B.
Free cash flow as a % of EBITDAC: 49%.
*Image: The Devil’s Financial Dictionary by Jason Zweig

