
November has past and healthcare open enrollment is behind us. It’s the time when spreadsheets are pulled together, employees and spouses (even actuaries) run front and back of the envelope calculations to decide where to enroll. Stock photos of happy couples in the 30-page guides beckon workers toward a tortuous process. It’s usually a choice of 2 or 3 medical plans. In many cases, it’s supposed to be kind of a pain, since one way for companies to lower benefit costs is to nudge, gently dissuade, or shove people off the company plans.
Growing deductibles and high deductible plans (HDHPs) in general are in the news. Some assume the plans are all the same, too much skin in the game, prone to delay care, unfair, the “all Texans wear cowboy hats” line of thinking. Despite what you may read, only 10% of companies offer only a high deductible plan* (which means $1,350 to $6,650 per person). The increase in deductibles is a symptom of the costs and the quantity of healthcare demanded. It’s not the cause of our system’s ills. See Singapore for example. They have mandated health savings accounts through payroll taxes and people pay ~50% of their care on average through dollars they control. A cool system. I do, however, recognize the issues of comparing the US to a 5M population city-state or to a Nordic country.
We know from the Affordable Care Act (ACA) plans, based on last year’s count of unsubsidized (>$24/hr equivalent) enrollees, the average deductible was $4,500 with a heavy favor towards narrow networks. People, when they pay the bill directly, recognize that premiums are something that can be minimized and that the universe of doctors and hospitals within 100 miles is sometimes worth restricting, at least with the menu they have before them. People can do the math, especially when money is on the line, and see that high, medium, low, catastrophic coverage almost always favors higher deductibles. Others bail into alternative forms of coverage such as short-term insurance or Ministry plans–rational choices for many.
It’s worth having a little nuance on deductibles and ranges of where they stand. Over 155M get their benefits through employer coverage. The Kaiser Survey Employer Survey data, the underlying data you need to be especially weird to request, requires you to fill out a form, convert files, trim data, and comb through 1,110 columns. Later you validate it against the broader report to make sure you didn’t transpose or fat-finger anything. Well, it kind of shows some insights into HDHPs, among many, many other things behind the numbers of that 200+ page report, the figures hidden behind the averages.
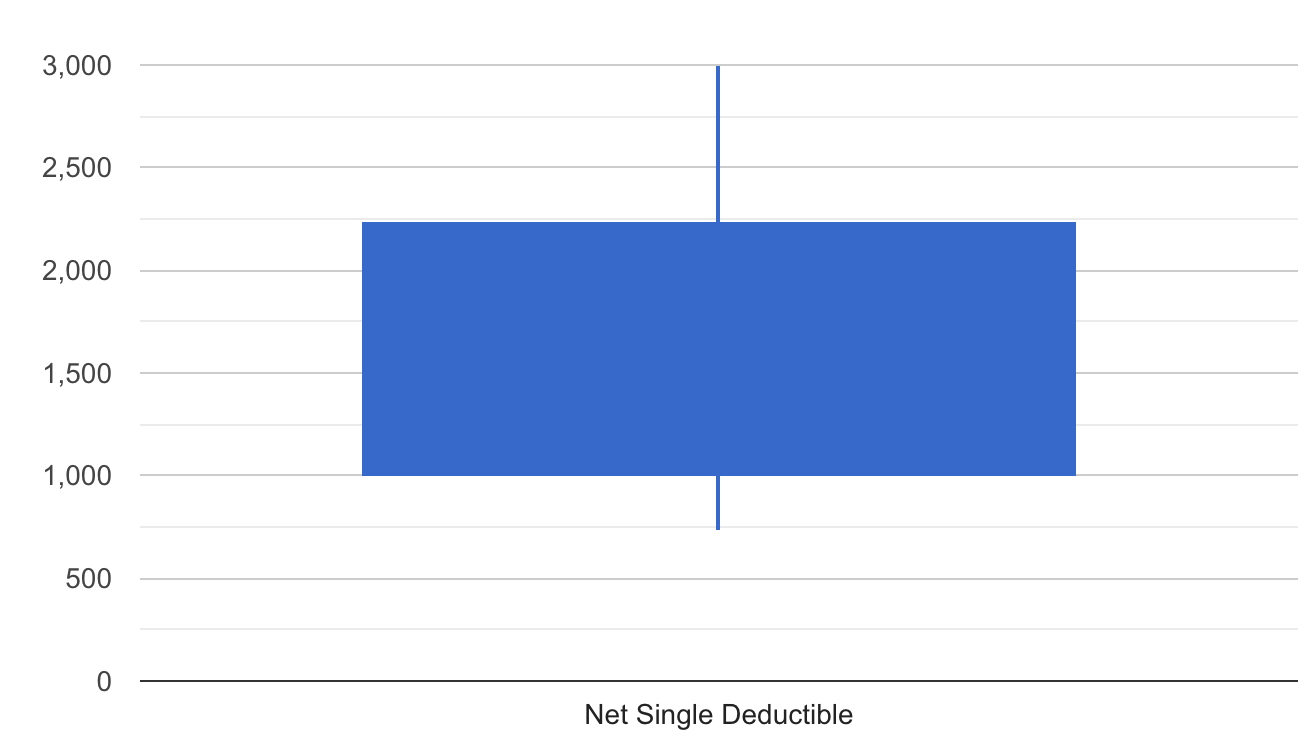
Below is the range of deductibles for those only enrolled in employer-sponsored HDHPs. This nets any company HSA contributions, which average $600 for those employers that contribute. The top of the candlestick chart is the 90th percentile, the bottom is the 10th, and the huge blue box is the IQR, or 25-75th percentiles. Keep this in mind when deductibles of $6,000 are mentioned in reference to the market for employer-sponsored benefits. That number is an outlier, and is <1% of those in employer-sponsored coverage.
That said, some enterprising consultants and advisors are revising the menu of plan choices, deciding which restaurants and cooks are best, breaking down the system and rebuilding it and how the meals are paid for. Until that changes, a HDHP will often be the best option given the limited menu offered.
*source: Kaiser 2018 survey data
Photo by John Macdonald on Unsplash